
13. Appendix 2 - choH (python version)#
13.1. Background#
choH (Klingon change), is a toy changepoint dection method implemented here in python.
13.2. Dependencies#
import scipy
from math import log
from functools import reduce
13.2.1. Utilities#
def compose(*funcs):
    return reduce(lambda f,g : lambda x : f(g(x)), funcs, lambda x : x)
13.3. Method#
def choH(data) : return list(map(compose(float,log,lambda i : scipy.stats.kstest(data[-i:],data[:-i]).pvalue),range(1,len(data))))
13.4. Examples#
import numpy
import matplotlib.pyplot as plt
13.4.1. Example 1 - no change#
numpy.random.seed(0)
X = [float(x) for x in list(numpy.random.normal(0,1,1000)) + list(numpy.random.normal(0,1,1000))]
plt.plot(X)
plt.plot(choH(X))
[<matplotlib.lines.Line2D at 0x72577687fc50>]

13.4.2. Example 2 - single change#
# change at t = 1001
numpy.random.seed(0)
X = [float(x) for x in list(numpy.random.normal(0,1,1000)) + list(numpy.random.normal(0.3,1,1000))]
plt.plot(X)
plt.plot(choH(X))
[<matplotlib.lines.Line2D at 0x72577625bb10>]
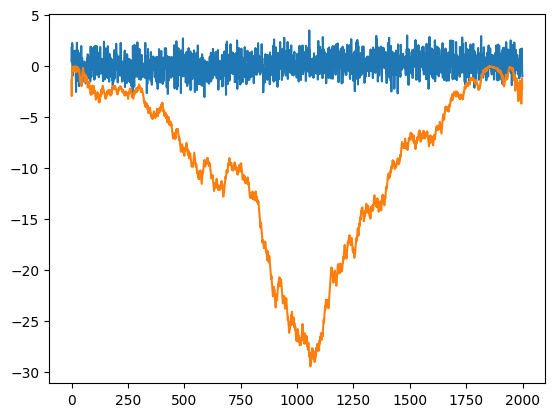
res = choH(X)
res.index(min(res))
1059